Charting log data to see trends
Table of Contents
Let data aggregation do the work for you
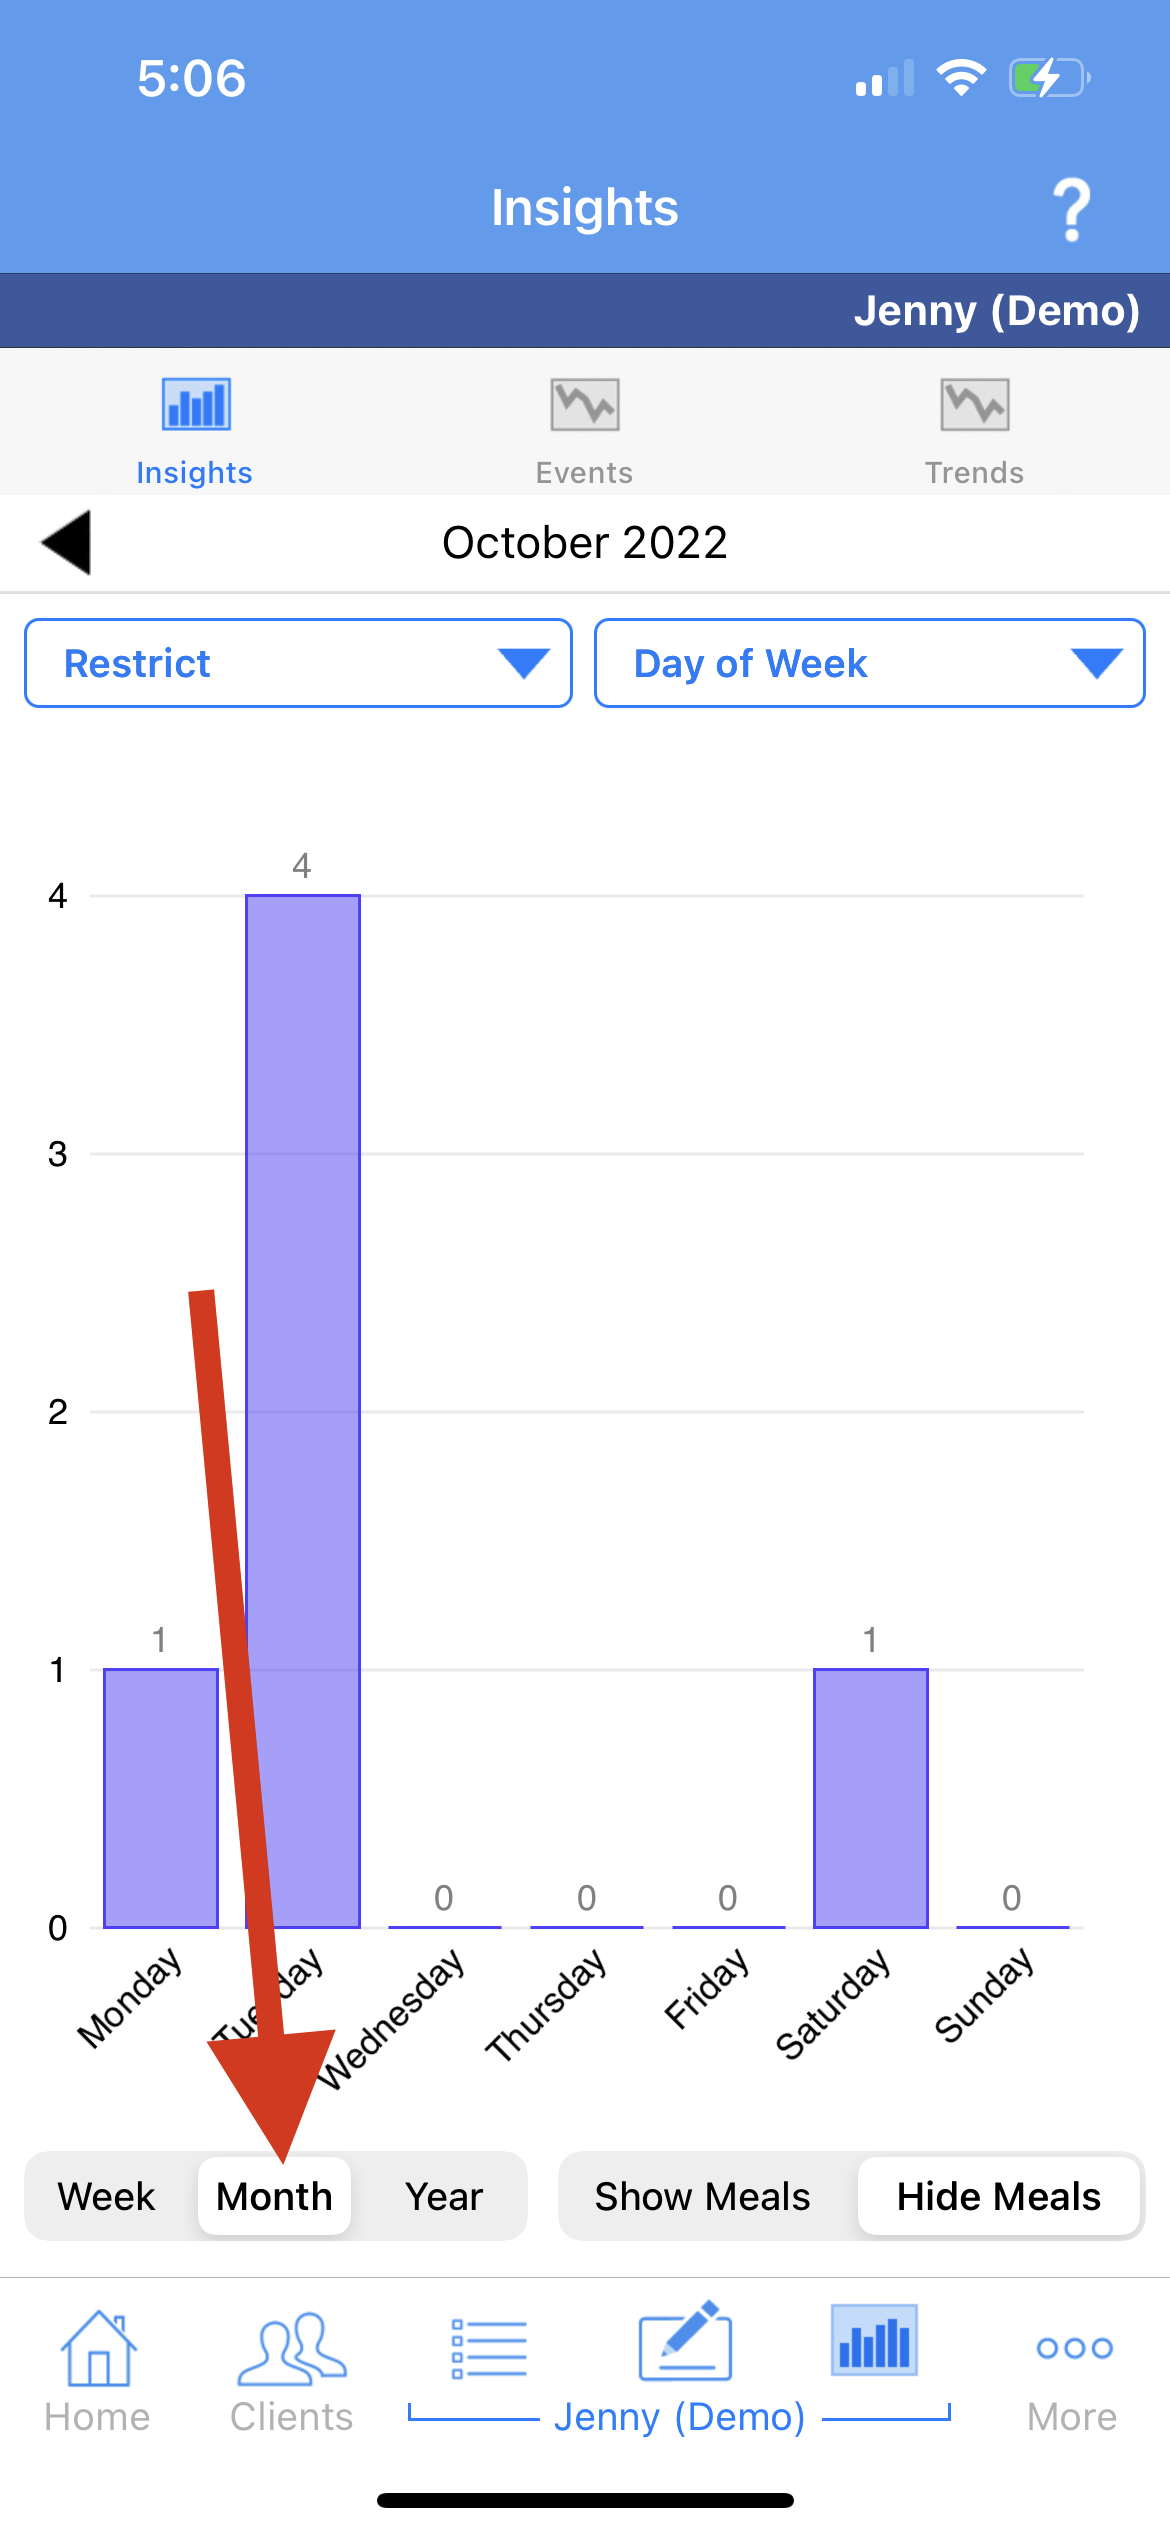
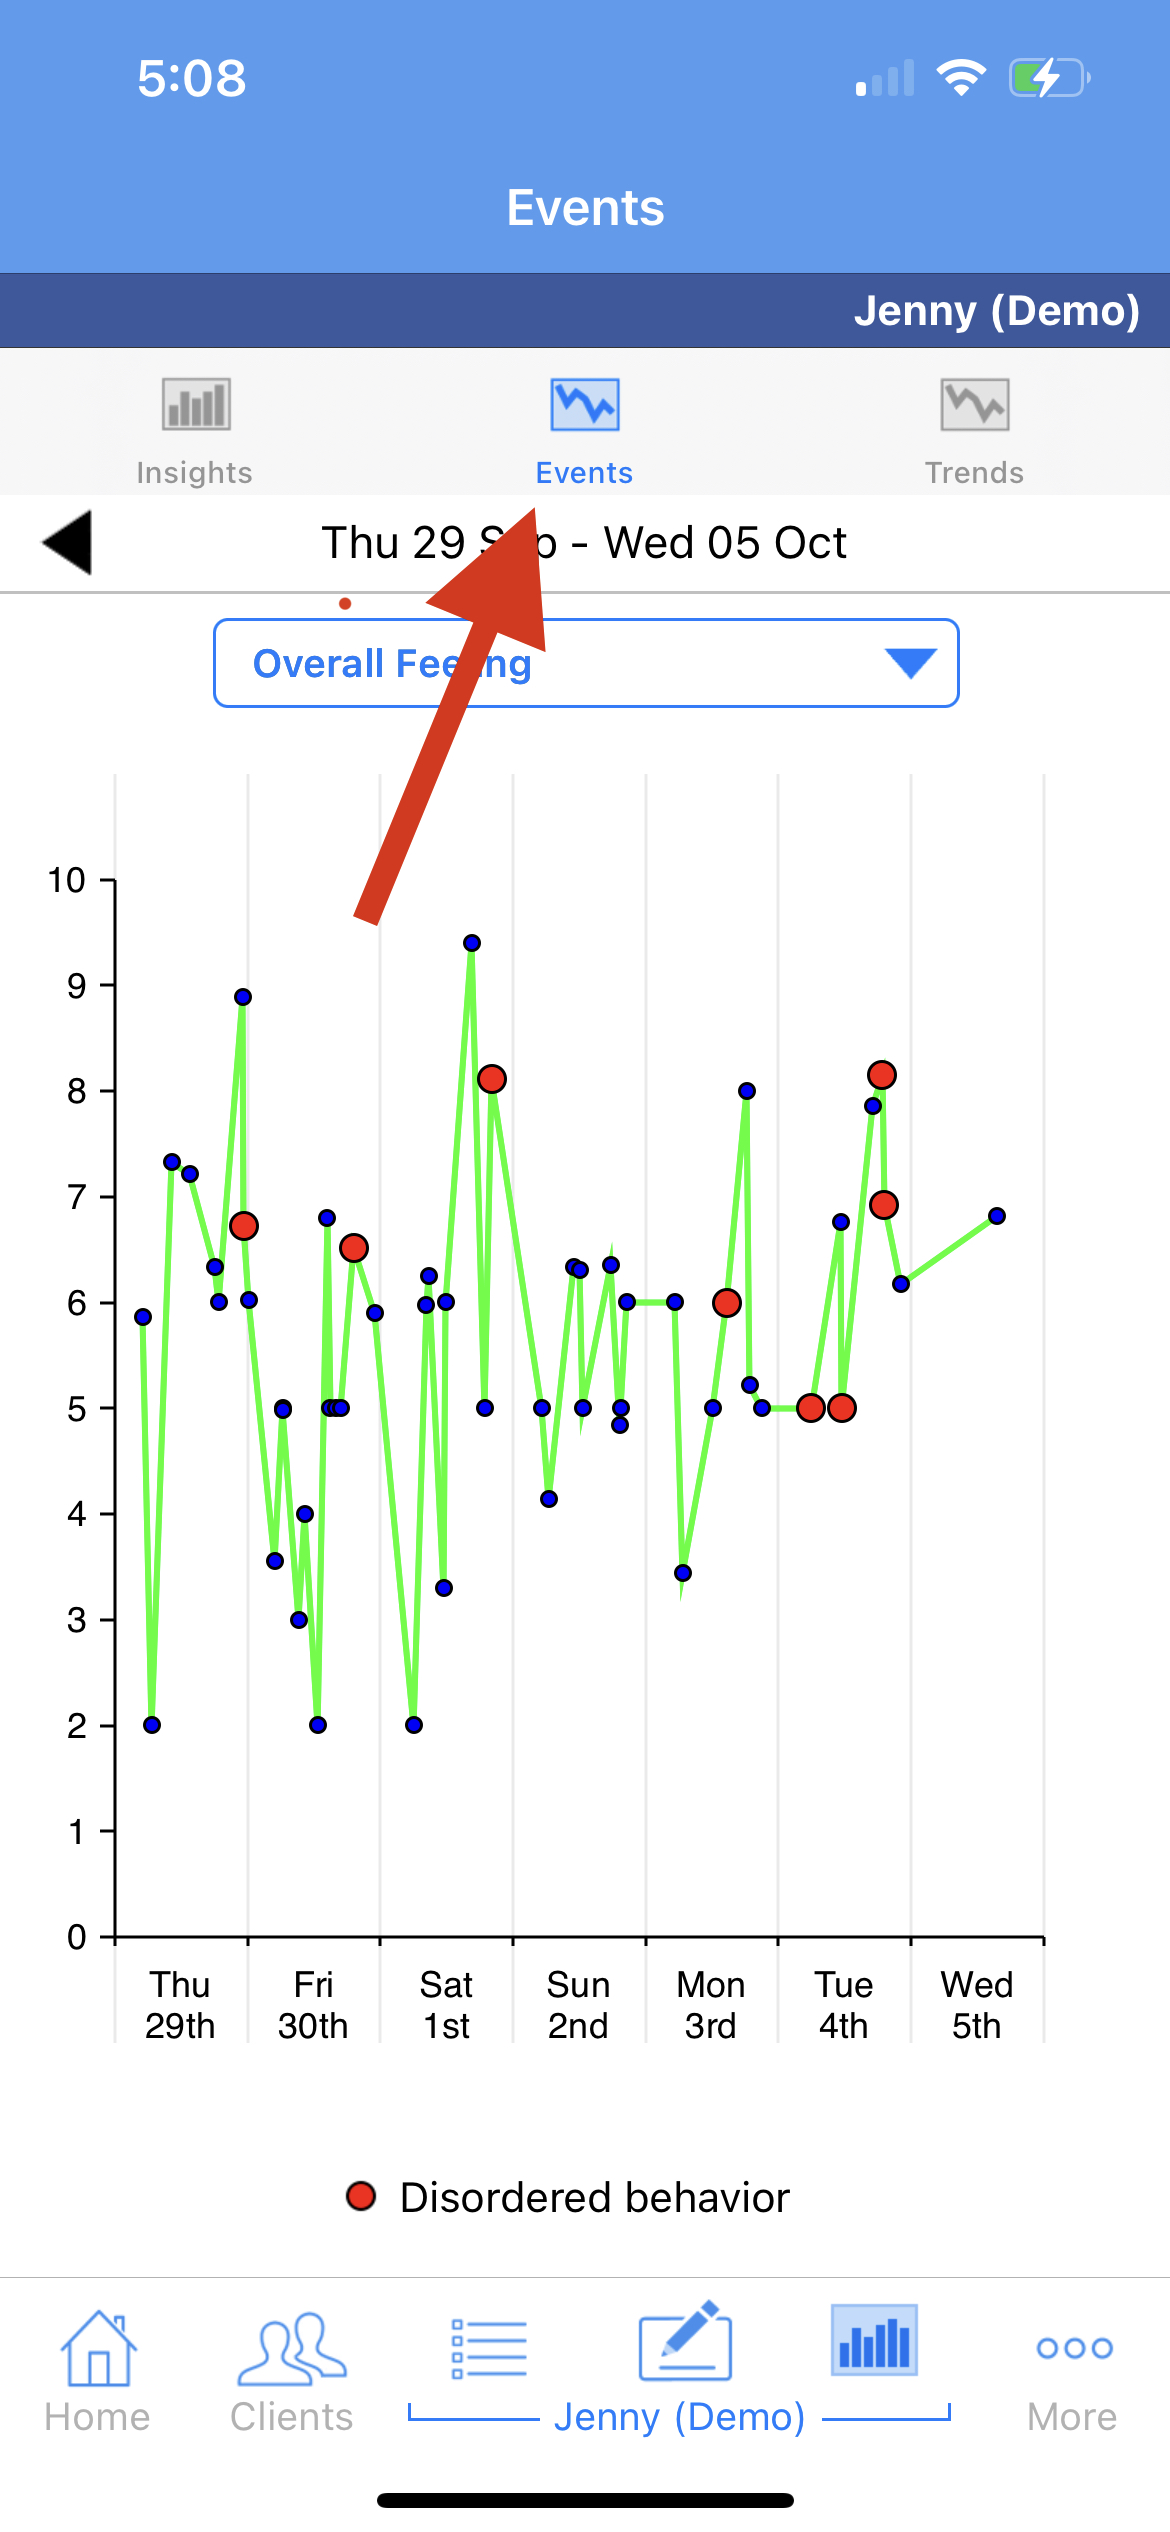
An incredible capability of capturing data digitally, is that it can be automatically aggregated to reveal client patterns and triggers. E.g., how emotional experiences relate to eating disorder symptoms, and how symptoms have developed over the past month.
Using charts to identify trends and share with clients
 |
 |
 |
Client is notified of comment and views this in client app
 |
Pro Tip: A picture is worth 1,000 words. Charts allow for the discovery of highly individualized patterns. You can look at charts together with your client in session to assist clients in organizing and understanding their data. Your client also has access to charts in their app. Why not ask them to review their charts before your next session, and tell you what they discovered? | Pro Tip: Charts are easily printable from the web interface. |
"The charts have given me the opportunity to recognize my emotional connection to food. For years I have struggled with either being on a strict diet or eating everything in sight, there was never really a middle ground. The charts have helped me to recognize my emotional patterns and it has been extremely helpful for me." - Recovery Record User
