US English (US)
PH English (Philippines)

Contact Us

If you still have questions or prefer to get help directly from an agent, please submit a request.
We’ll get back to you as soon as possible.

Please fill out the contact form below and we will reply as soon as possible.

  • Contact Us
English (Philippines)
US English (US)
PH English (Philippines)
  • Home
  • Recovery Record for Clinicians
  • Learn

Charting log data to see trends

Written by Stuart Argue

Updated at October 14th, 2022

Contact Us

If you still have questions or prefer to get help directly from an agent, please submit a request.
We’ll get back to you as soon as possible.

Please fill out the contact form below and we will reply as soon as possible.

  • Recovery Record for Clinicians
    Learn Linking with Patients Introducing Patients to the App Patient Experience Privacy Subscriptions & Billing Logging Boundary Setting Account Management Security & Passwords Research Odd App Behavior Bespoke Customizations Miscellaneous Group Accounts
  • Recovery Record
+ More

Table of Contents

Let data aggregation do the work for you Using charts to identify trends and share with patients Patient is notified of comment and views this in patient app

Let data aggregation do the work for you

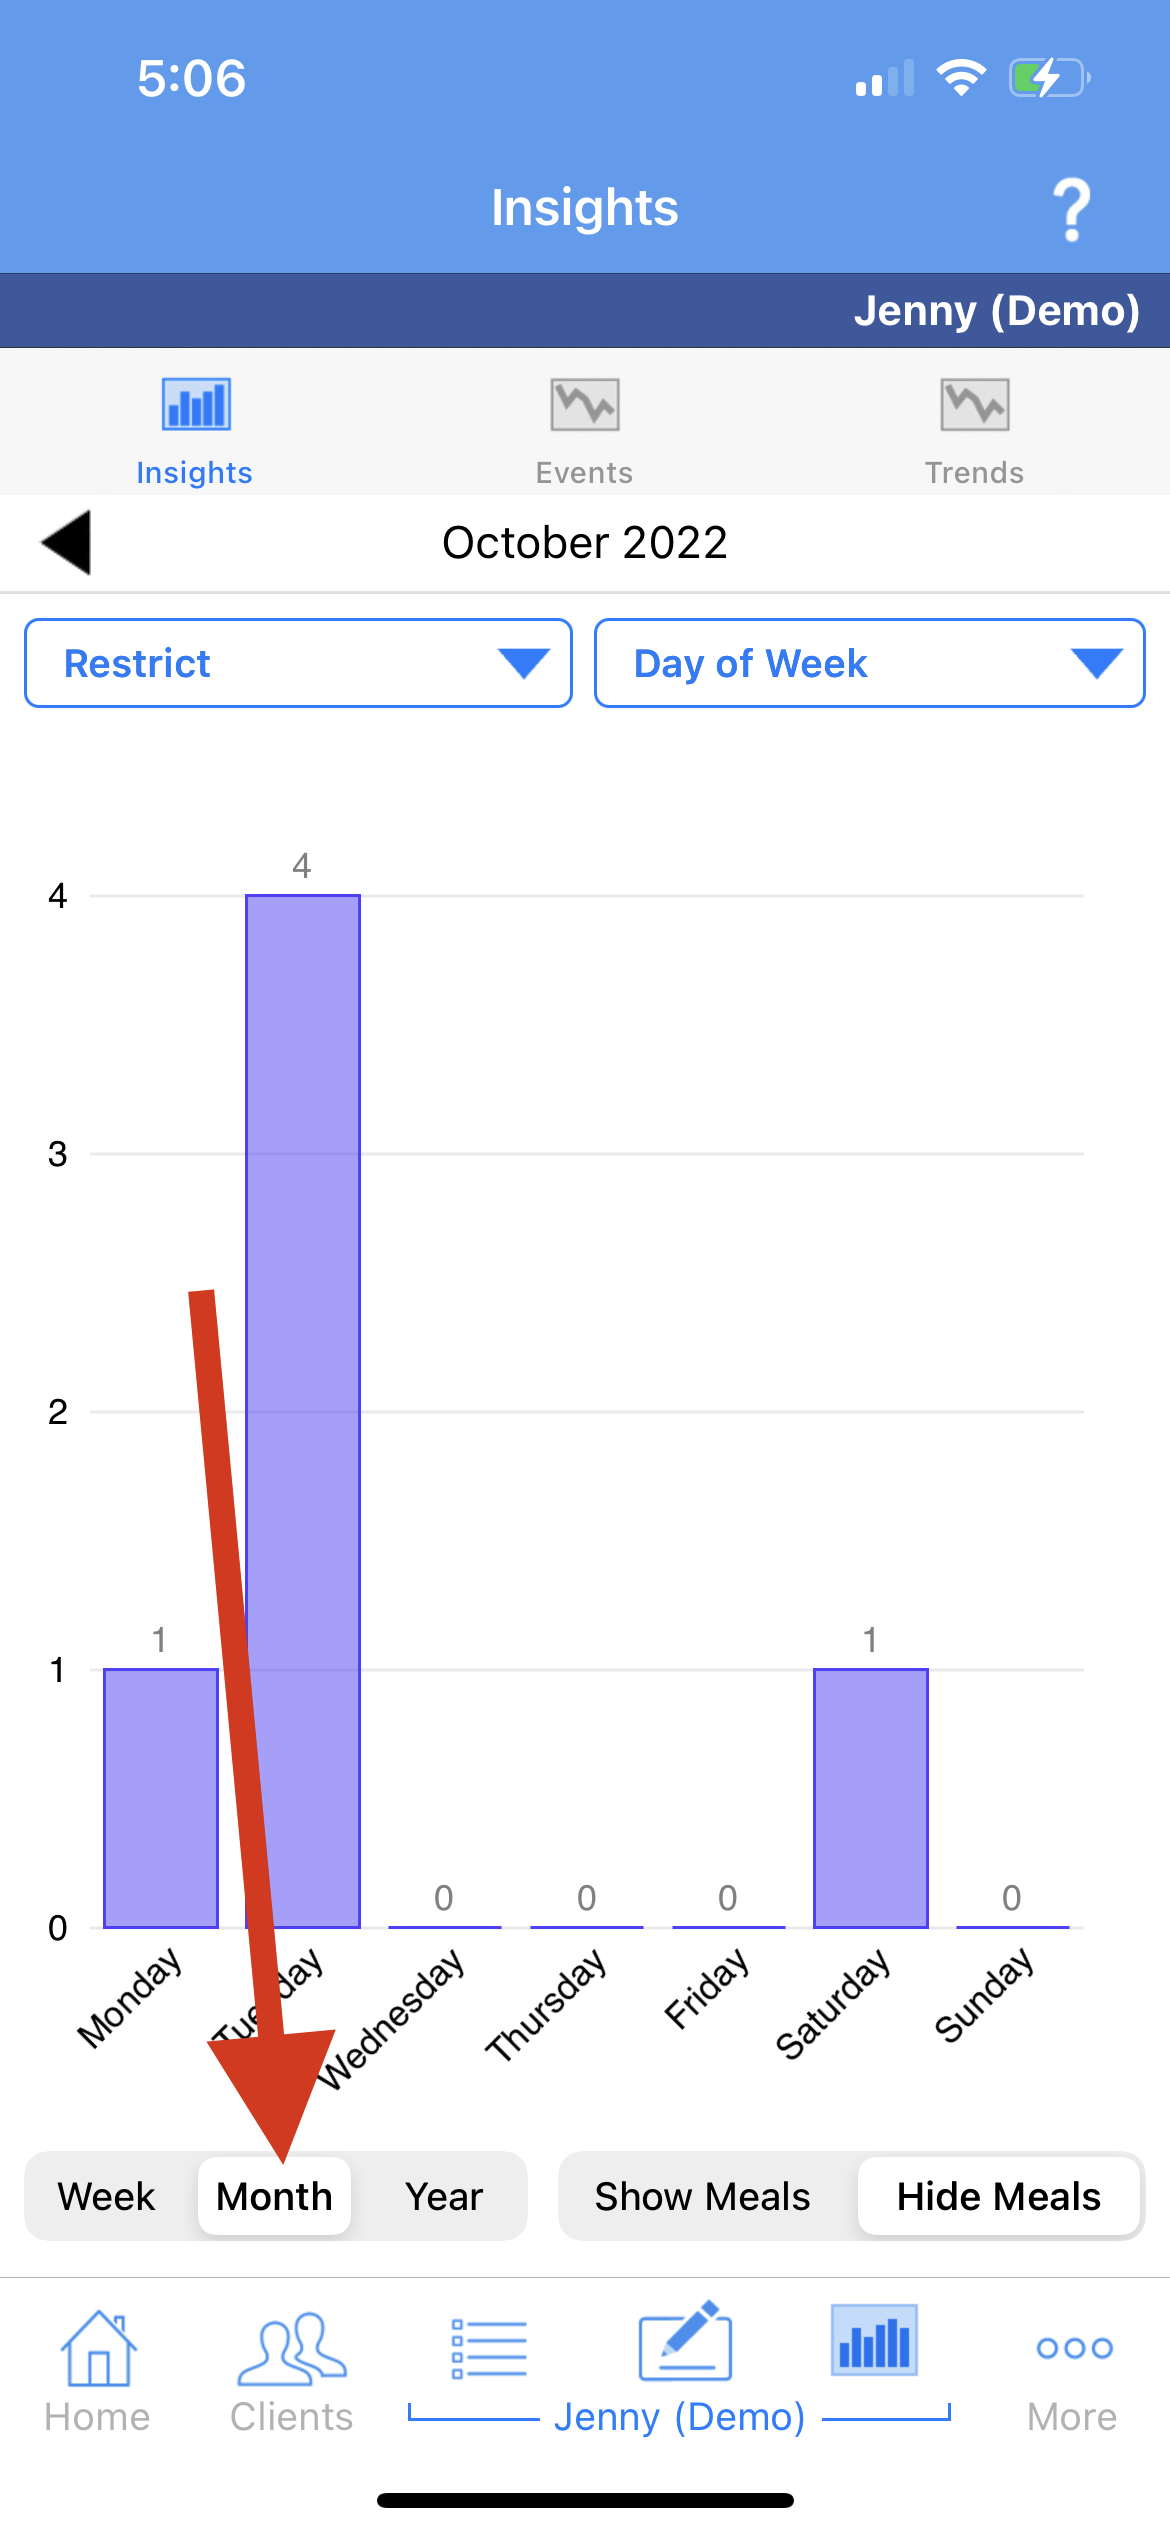
An incredible capability of capturing data digitally, is that it can be automatically aggregated to reveal patient patterns and triggers. E.g., how emotional experiences relate to eating disorder symptoms, and how symptoms have developed over the past month.

Using charts to identify trends and share with patients

Click into the "Charts" feature listed in the patient menu.
Click on the drop down variable menu and use spinners to select the variables you would like to chart.
A chart will instantly be generated. You can opt to view a week, month or year of data down the bottom.

Patient is notified of comment and views this in patient app

We have three types of charts. This is the “Events” chart that can plot things like overall feeing over time. The red dots indicate one or more disordered behaviors.
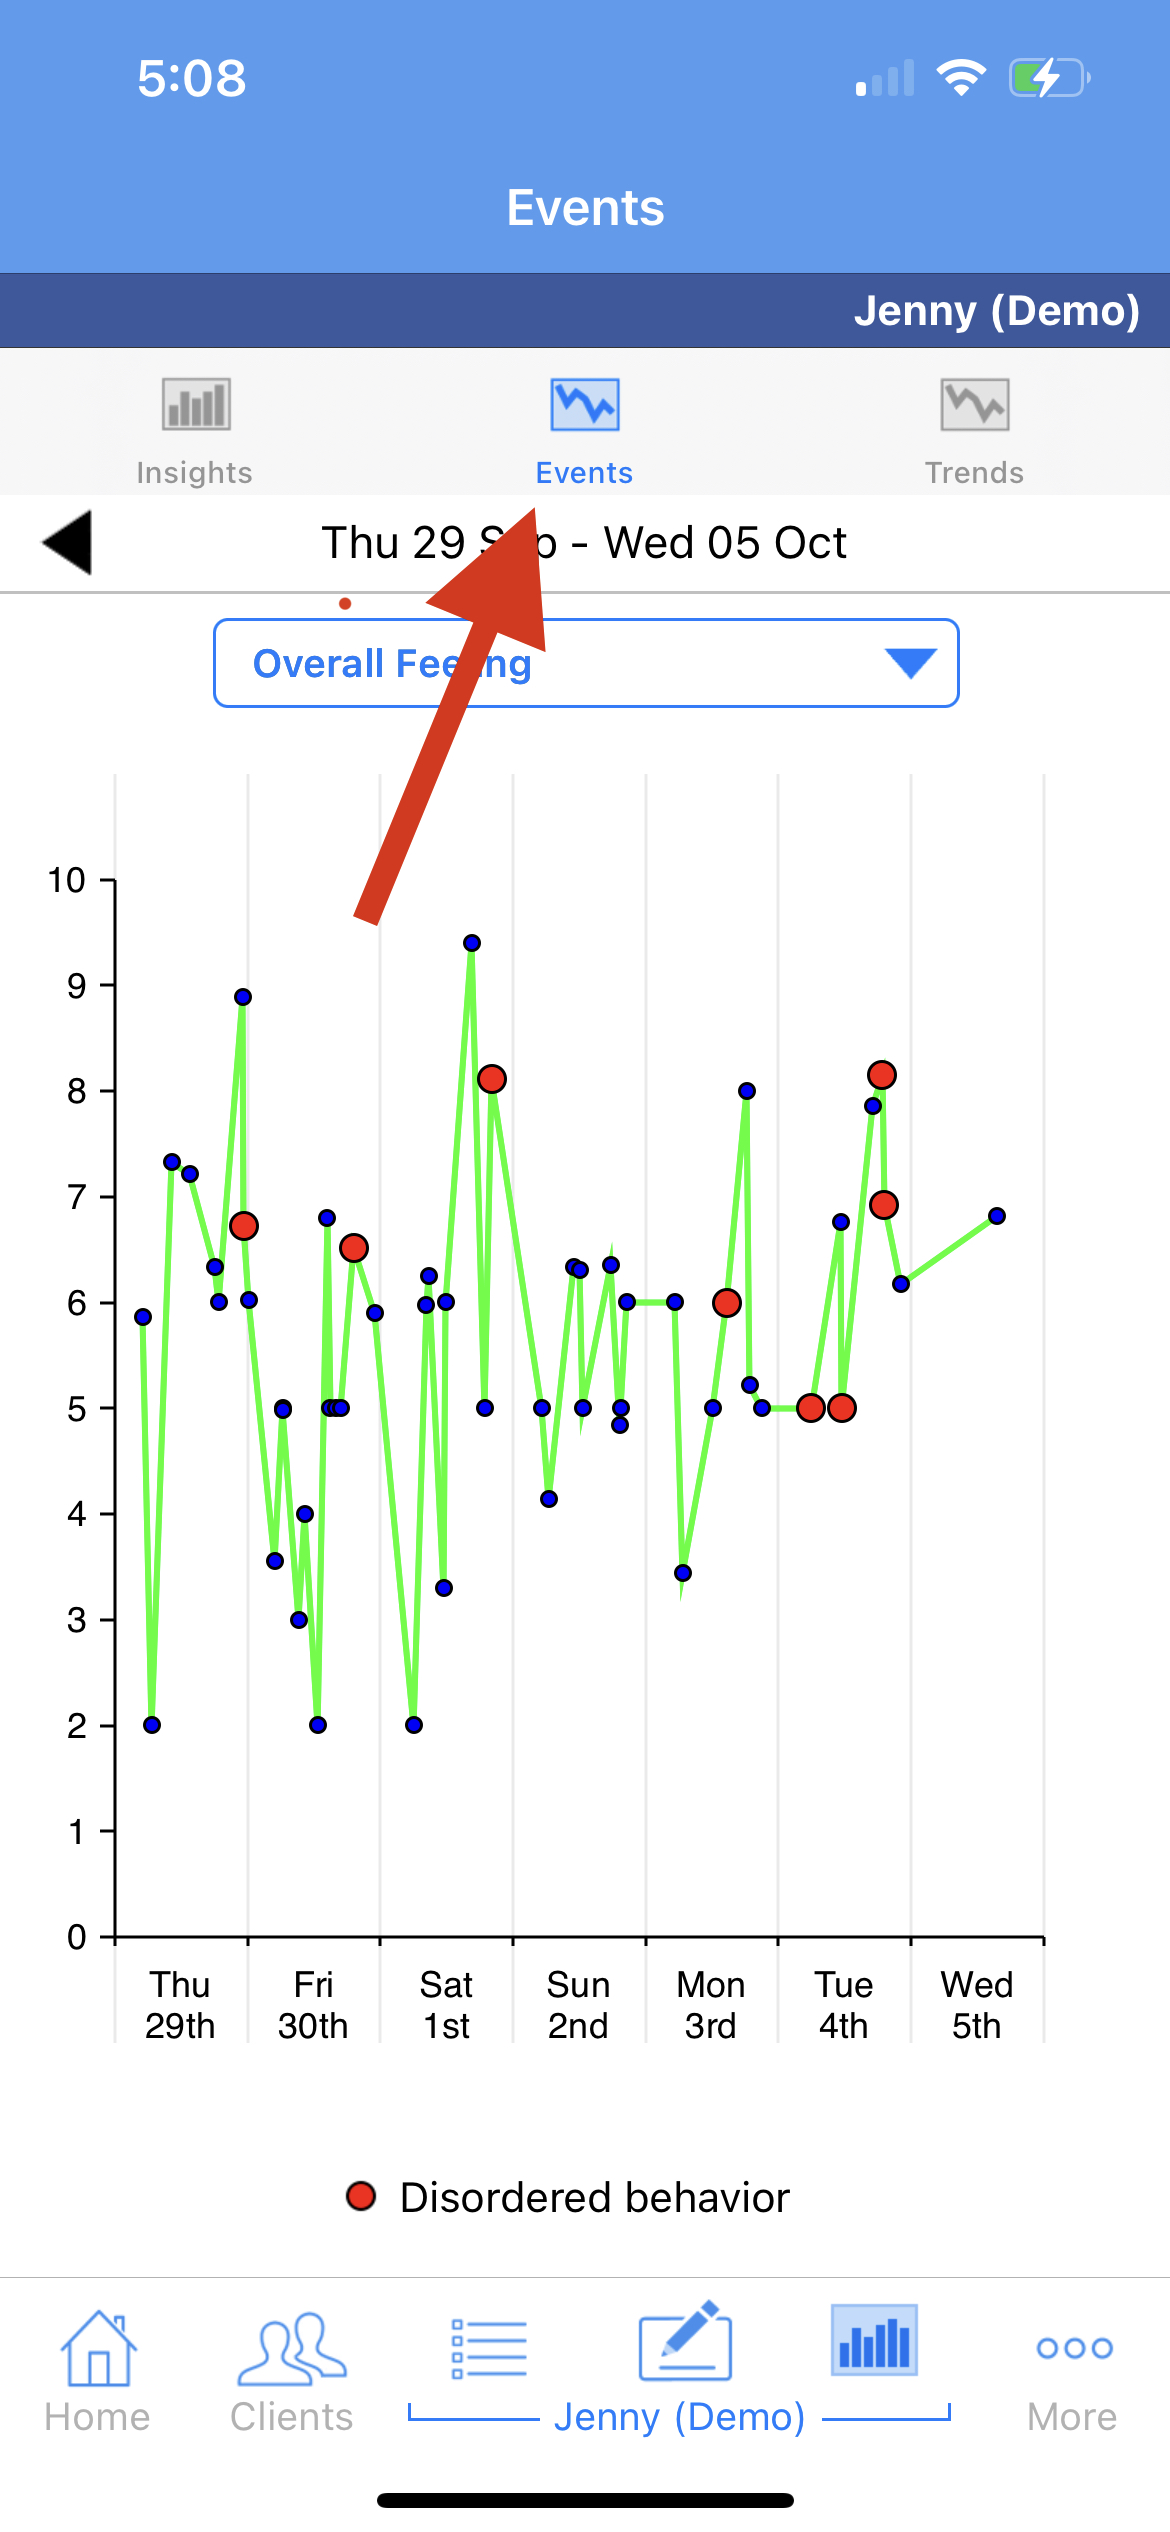
Pro Tip: A picture is worth 1,000 words. Charts allow for the discovery of highly individualized patterns. You can look at charts together with your patient in session to assist patients in organizing and understanding their data. Your patient also has access to charts in their app. Why not ask them to review their charts before your next session, and tell you what they discovered? Pro Tip: Charts are easily printable from the web interface.

"The charts have given me the opportunity to recognize my emotional connection to food. For years I have struggled with either being on a strict diet or eating everything in sight, there was never really a middle ground. The charts have helped me to recognize my emotional patterns and it has been extremely helpful for me." - Recovery Record User

Was this article helpful?

Yes
No
Give feedback about this article

Related Articles

  • Setting up Exchange Targets - Daily or Meal by Meal
  • Sleep and Stool tutorial video
  • Interpreting Patient's EPSI Scores
  • Clinician Web Interface: Orientation and Best Practices

Content over

Footer

Products
  • Patient iPhone
  • Patient Android
  • Clinician Web
  • Clinician iPhone
  • Clinician Android
  • Clinician iPad
  • Recovery Path
  • Mood Links
  • Nourishly
Partners
  • Providers
  • Health Plans
  • Research
  • Clinicians
About
  • Company Info
  • Contact
  • Terms of Use
  • Privacy Policy
  • Bright Therapeutics
Web
  • Clinician Registration
  • Clinician Login
  • Patient Login
  • Clinic Dashboard Login
  • Outcomes tool login
  • Login Choices
Clinicians
  • Therapists
  • Psychologists
  • Dietitians
  • Counselors
  • DBT Treatment Professionals
  • CBT Treatment Professionals
  • Skills Library
  • Treating ARFID
Recovery Record on Facebook Recovery Record on Twitter

© 2022 Recovery Record.All Rights Reserved.


Knowledge Base Software powered by Helpjuice

Expand